WORLD-FIRST AMBITION
AES-256-GCM
USER-ISOLATED VAULT
AGENTIC AI
YOUR AI WORK.
ENCRYPTED.
ENCRYPTED AGENTIC SUPERPOWER.
Bring Your AI. Bring Your Project. Keep your digital work inside one protected AION workspace. The Secure Vault architecture is built to store user-scoped chat assets, photos, videos, audio, documents, code, website projects, data, presentations, research, 3D assets and workflow outputs through encrypted storage — while AION coordinates memory, RAG, agents and verified execution.
One Human. Many AIs. Complete AI Workforce. Your provider may change; your project continuity does not have to. AION keeps the workspace, files, memory and workflow evidence under one user-isolated operating layer.
AES-256-GCM STORAGEAuthenticated encryption for vaulted file payloads.
PER-USER ISOLATIONVault root and derived key are scoped by user code.
CSRF-GATED MUTATIONSState-changing vault actions require request protection.
AUDITABLE ACCESSVault actions can be recorded in access logs.

AION SECURE VAULT
Protected project continuity for files, media, code, workflows and agent outputs.
AES-256-GCMCHATConversations · attachments · memory
PHOTOSOriginal · generated · edited · upscale
VIDEOSOriginal · generation · reels · lipsync
PROJECTSWebsite · assets · backups · deployments
CODEPHP · JS · SQL · Python · React · Flutter
WORKFLOWSDefinitions · runs · outputs · audit
SERVER-SIDE KEY DESIGNPer-user vault key is derived server-side, not exposed by this public page.
PRIVATE VAULT ROOTEncrypted vault data is configured outside the public web root.
UPLOAD POLICYDangerous executable/script formats and suspicious double extensions are blocked.
SMART STORAGE ROUTINGFiles route by MIME, operation and workspace context.
INTEGRITY METADATAMetadata records original hash, MIME, size and routing context.
AUDIT + SEARCHVault API supports search, metadata, download and audited mutations.
Encrypted continuity is the foundation of the AION project brain.Chat assets, media, documents, code, project files and workflow outputs can live under one user-isolated vault architecture while agents work through controlled tools and permissions.
SECURE VAULT V3
EBOLA AI • NEXT-GENERATION AGENTIC INTELLIGENCE
EBOLA AI
AGENTIC SUPER
INTELLIGENCE OS
RETAIL
!
TRADING
!
SHARE AI COMMERCE
!
EDUCATION
!
AI PASSPORT
!
AI FUNDING
One Human. Complete AI Workforce. One intelligent operating layer connecting commerce, markets, learning, digital identity and funding workflows through coordinated AI agents, tools, memory and human-controlled autonomous execution.
AGENTIC AI
COGNITIVE BRAIN
SUPER MEMORY
MULTI-AI
AGENT WORKFORCE
AUTONOMOUS EXECUTION
THINK • PLAN • ACT • VERIFY • DELIVER
EBOLA AION coordinates intelligence, agents, tools, memory and files as one operating system.
EBOLA AI
AGENTIC SUPER INTELLIGENCE OS
RETAIL AIAutonomous commerce
TRADING AIMarket intelligence
SHARE AI COMMERCESocial → commerce
EDUCATION AILearn + build + achieve
AI PASSPORTIdentity + continuity
AI FUNDINGFunding workflows
AION APPLICATION LAYER · AGENTIC TRAVEL × RETAIL AI
One Agentic AI.
Every Journey.
Every Business.
PLAN • BOOK • PAY • TRAVEL • EARN — WITH AI.
One EBOLA AI subscription connects autonomous AI agents with Flights, Hotels, Bus, Train / IRCTC, Holidays, Visa, Homestays, Recharge, Bill Payment, Money Transfer, Mini ATM and business utilities.
AI PLANS
AI BOOKS
AI PAYS
AI EARNS
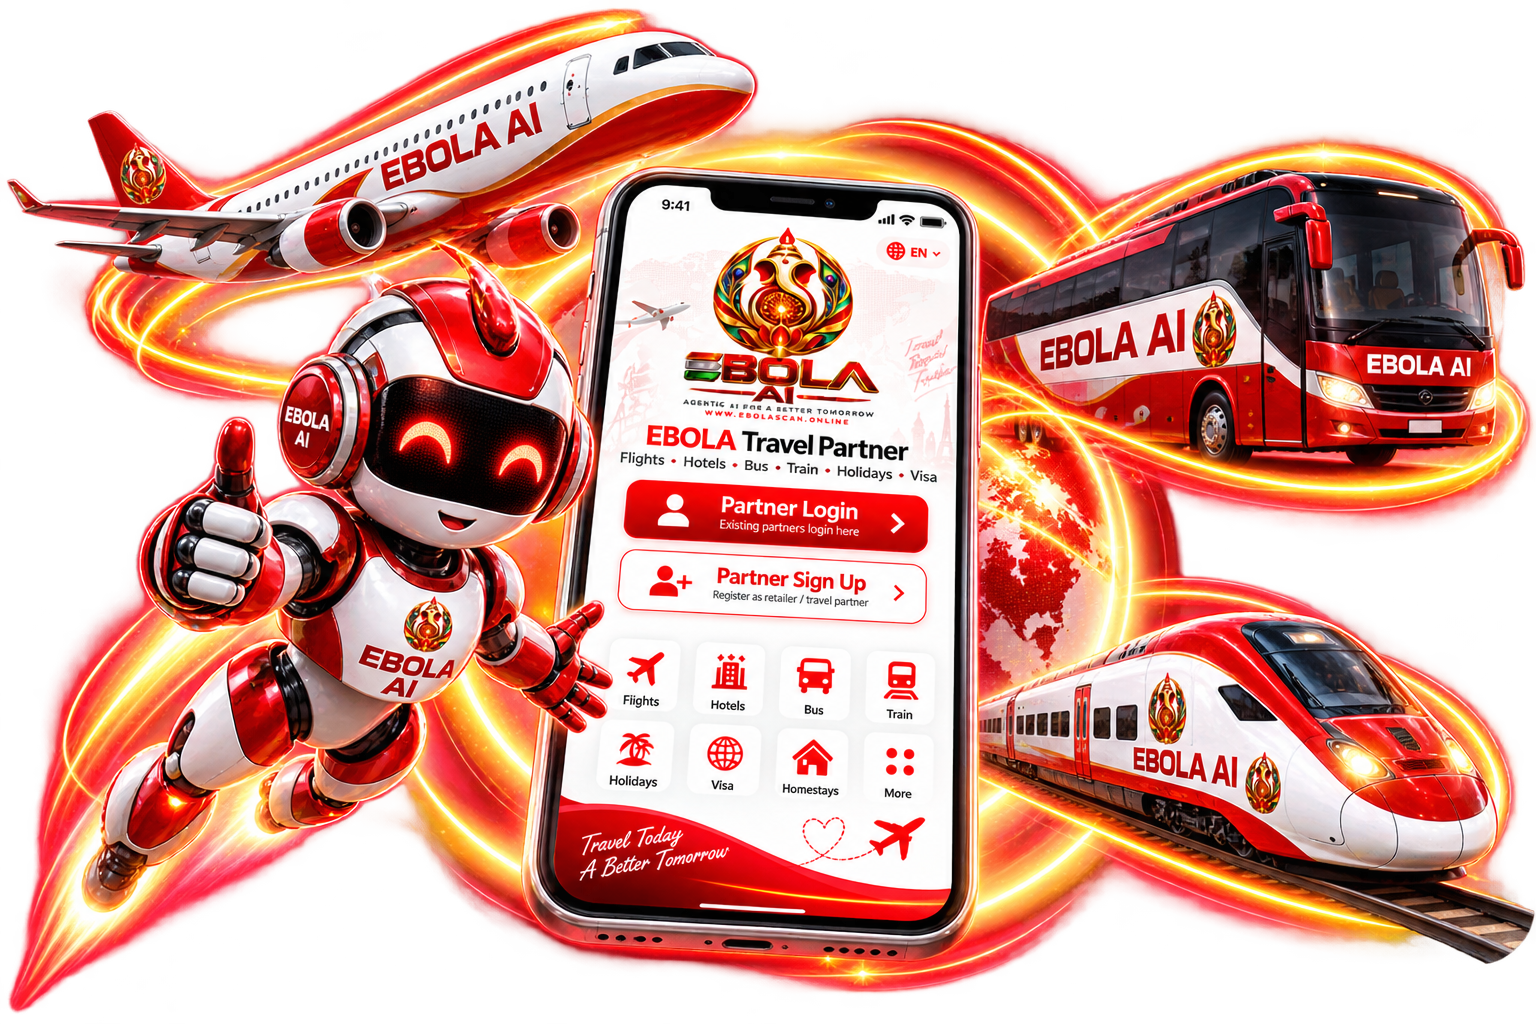
Flights
Hotels
Buses
IRCTC
Visa
Homestays
Holidays
Web Check-in
Recharge
Bill Pay
Money Transfer
Mini ATM
5 SUBSCRIPTION OPTIONSEvery subscriber gets Agent AI Login • Retail AI access included
AION Essential₹500AI tools + Agent AI login
AION Pro₹1,000Advanced AI + automation
Family Pack₹5,000Main account + up to 3 family IDs
Retail AI₹5,000Travel + utility + B2B services
One Person Company₹5,000AI workforce + business automation
SET YOUR COMMISSION • EARN MONEYRetail AI business opportunity • Service availability and commissions depend on provider/account eligibility.
View Plans →UNDERSTAND
Intent + Context
Intent + Context
REMEMBER
Relevant Memory
Relevant Memory
PLAN
Task Graph
Task Graph
COMPILE
Internal Prompt
Internal Prompt
CHOOSE AI
Model + Provider
Model + Provider
ORCHESTRATE
Agents + Tools
Agents + Tools
EXECUTE
Workflows + Actions
Workflows + Actions
VERIFY
Judge + Evidence
Judge + Evidence
SAVE
Files + Checkpoint
Files + Checkpoint
LEARN
Outcome Memory
Outcome Memory
12 Intelligence Systems
A complete autonomous intelligence stack.
The interface stays simple. Behind it, specialist intelligence systems collaborate to understand, plan, decide, act, verify and preserve context.
01
UPGRADING
Cognitive Master Brain
Understand the human goal before choosing a model, tool or agent.
Universal Intent Understanding
Language & Noise Normalization
Context Assembly
Complexity Detection
Cognitive Prompt Compiler
Decision Routing
02
CORE BUILT
Super Memory Intelligence
Operational continuity across conversations, projects, files, agents and outcomes.
Working + Long-Term Memory
Project & File Memory
Temporal Truth
Hybrid Retrieval
Failure / Lesson Memory
Evidence + Confidence
03
ARCHITECTURE
Decision & Reasoning
Evaluate evidence, risk, cost, alternatives and expected outcome.
Option Generation
Evidence Scoring
Risk Analysis
Outcome Prediction
Confidence Scoring
Decision Engine
04
IN DEVELOPMENT
Multi-Agent Intelligence
Many specialists operating as one coordinated workforce with shared authorized context.
Sequential Agents
Parallel Agents
Conditional Routing
Hierarchical Teams
Debate & Voting
Cross-Agent Memory
05
ROADMAP
Dynamic Agent Foundry
Create or assemble the specialist capability only when the work demands it.
Capability Gap Detection
Dynamic Agent Creation
Tool Assignment
Permission Assignment
Agent Testing
Archive / Promote
06
ARCHITECTURE
Connectivity Layer
Connect agents, tools, data, providers and external systems.
MCP
A2A Communication
APIs
Webhooks
Event Bus
Connector Registry
07
IN DEVELOPMENT
Autonomous Execution
Run workflows, recover failures and continue safely from verified state.
Workflow Engine
Background Runs
Scheduling
Checkpoint / Resume
Retry / Re-plan
Self-Healing Recovery
08
CORE CONTROLS
Security & Trust
High autonomy with controlled authority and evidence.
Agent Identity
Zero Trust
Least Privilege
Human Approval
Sandbox Execution
Audit Trail
09
ROADMAP
Cost & Optimization
Choose the right intelligence for quality, latency, context and budget.
Model Router
Tool Router
Agent Router
Token Budget
Time / Cost Budget
Quality-Cost Optimizer
10
MULTI-MODE
Multimodal Intelligence
One operating layer across text, vision, media, documents, voice and code.
Vision / OCR
Document AI
Voice / Realtime
Image / Video AI
Deep Research
CODIAX / Artifacts
11
NEW LAYER
Universal Multi-AI Provider Bus
AION can route work across multiple intelligence providers without surrendering project continuity.
Provider Registry
Capability Registry
Provider Router
Fallback Chain
Multi-Model Consensus
Result Judge
12
NEW LAYER
Universal Files & Continuity
Every useful output becomes an AION-owned, versioned and memory-linked project asset.
Canonical File Store
Provider File Bridge
File DNA
Version Timeline
Cross-Session Workspace
Cross-Provider Continuity
System Architecture
One request. One intelligent execution graph.
AION automatically decides how much intelligence and autonomy a task actually needs.
HUMAN / EVENT
→
COGNITIVE BRAIN
→
SUPER MEMORY
→
PROMPT COMPILER
→
TASK PLANNER
PROVIDER ROUTER
→
MULTI-AI + AGENTS
→
MCP / A2A / API
→
EXECUTION
ZERO TRUST
→
APPROVAL
→
JUDGE / VERIFIER
→
UNIVERSAL FILES
→
OUTCOME MEMORY
FAIL → Diagnose → Retry / Tool Swap / Model Swap / Agent Swap / Re-plan → Resume from Checkpoint ↻
◉ EBOLA GOLD COIN × AION MEMORY
MONTHLY MEMORY RENTAL1 EGC / MONTHNO HOLD REQUIREMENT • VERIFIED RENTAL PAYMENT • MEMORY RECALL ACCESS
Keep your AI project memory LIVE.
AION Memory Locker is designed as the access layer for persistent project recall. One verified EGC monthly entitlement can keep an eligible Memory Locker active. If entitlement expires, recall is locked while retained memory remains stored according to the configured retention policy. Reactivation can restore access to eligible retained project memory.
1 EGC / MONTH — MONTHLY MEMORY RENTAL
AION MEMORY LOCKER
CROSS-SESSION RECALL
PROJECT CONTINUITY

1 EGC VERIFIEDmonthly entitlement
MEMORY ACTIVEauthorized recall
AGENTS CONNECTEDproject graph context
RESUME PROJECTlatest verified checkpoint
MAX EGC SUPPLY108,000,00010 Crore 80 Lakh
LIVE COIN MINED37,529.0000successful ledger rewards
SHAREAI COMMERCE EGC34,389.0000referral-share ledger rewards
LIVE SOCIAL PLATFORMS15platforms with successful shares
LIVE SHAREAI COMMERCE → EGC NETWORK
Which social media is mining / earning EGC?
● LIVE DATABASE
TOTAL EGC MINED37,529.0000
SHAREAI COMMERCE EGC34,389.0000
SOCIAL SHARE EVENTS20,082
TODAY SHARES10
UNIQUE MINERS337
LIVE SOCIAL MEDIA DISTRIBUTION
Share count + EGC reward from successful referral_share ledger rows
6,270
WhatsApp
11,490.0000 EGC
3,669
Telegram
6,947.0000 EGC
2,414
Facebook
4,812.0000 EGC
2,100
Admin Repair
2,100.0000 EGC
1,337
LinkedIn
2,484.0000 EGC
1,137
Email
1,601.0000 EGC
827
Copy
1,167.0000 EGC
624
Reddit
1,045.0000 EGC
614
Twitter
1,329.0000 EGC
447
VK
608.0000 EGC
355
Pinterest
518.0000 EGC
284
Forward
284.0000 EGC
2
Other
2.0000 EGC
1
X
1.0000 EGC
1
Gmail
1.0000 EGC
EGC MINED BY LEDGER SOURCE
Shows exactly which event_source created successful EGC rewards
referral_share
34,389.0000 EGC
20,082 successful events
signup_bonus
2,880.0000 EGC
288 successful events
kyc_aadhaar_verified
125.0000 EGC
5 successful events
kyc_pan_verified
60.0000 EGC
6 successful events
product_ocr_add_egc
50.0000 EGC
5 successful events
kyc_passport_verified
15.0000 EGC
1 successful events
daily_node_activate
10.0000 EGC
1 successful events
ENCRYPTED PROJECT MEMORY ARCHITECTURE
Rental controls access. Encryption protects the memory.
SEPARATE SECURITY LAYER
USER + PROJECTisolated identity scope
ENCRYPTprotected before durable storage
PRIVATE MEMORY VAULTencrypted project memory + secure references
HASH + INTEGRITYversion/evidence verification
AUTHORIZED AGENTSretrieve only permitted relevant context
1 EGC = ACCESS ENTITLEMENTThe coin is not the encryption key.
KEYS / CREDENTIALS SEPARATESecrets stay outside ordinary semantic memory.
USER / PROJECT ISOLATIONNo automatic cross-user or cross-project recall.
EXPIRY = SOFT LOCKExpiry blocks recall; it does not itself mean hard deletion.
AION MEMORY LOCKER COMPARISON
From chat memory to operational project memory.
PROJECT MEMORY DNA
| CAPABILITY | TYPICAL CHAT / MEMORY | AION MEMORY LOCKER DESIGN |
|---|---|---|
| Cross-session recall | ✓ | ✓ Project-scoped |
| Encrypted persistent memory | Varies | ✓ Separate encryption layer |
| Project checkpoint / resume | Limited | ✓ Project Time Machine |
| File DNA + SHA-256 + versions | — | ✓ Canonical file evidence |
| Database schema / dependency memory | — | ✓ Project dependency graph |
| Error → Root Cause → Fix → Test | — | ✓ Failure Intelligence |
| Image / video / document lineage | Basic attachments | ✓ Multimodal lineage |
| Agent execution evidence | — | ✓ Task/tool/result evidence |
| Shared authorized agent recall | Varies | ✓ 60-agent project graph target |
| Monthly memory access entitlement | — | ✓ 1 EGC / month |
| Expiry behavior | Vendor dependent | Soft-lock recall; retention separate |
Positioning: AION is designed around operational project continuity — files, database objects, decisions, failures, fixes, tests, deployments, media and agent evidence — not only conversation recall.
How 1 EGC Monthly Memory Rental connects to AION Memory OS
VERIFIED EGC RENTAL PAYMENT1 EGC monthly payment through an approved verification route; no hold requirement
→
1 EGC VERIFIEDmonthly locker entitlement becomes active
→
MEMORY UNLOCKretriever can access authorized project memory
→
AGENTS RECALLfiles, checkpoints, decisions, fixes and context
→
CONTINUE WORKnew session resumes from verified project state
● LOCKER ACTIVE
Memory can participate in authorized AI recall.
Project identity → checkpoint → File DNA → decisions → agent evidence → relevant memory retrieval → current work.
● LOCKER INACTIVE
Recall locked — not automatically erased.
Expired entitlement blocks normal project-memory retrieval. Retained data stays subject to retention, privacy and deletion policies. A later verified entitlement can restore eligible retained recall.
Architecture rule: 1 EGC/month is a Memory Locker rental/access entitlement — not an encryption key and not a hold requirement. Payment verification, entitlement, retrieval authorization, encrypted storage, retention and deletion remain separate security boundaries. Production acceptance rules must be enforced by backend verification, not by this UI alone.
Persistent Memory Intelligence
Memory is not chat history.
AION separates immediate working state from durable project knowledge and retrieves only the memory relevant to the current decision.
Working MemoryACTIVE
Conversation MemoryINDEXED
Episodic MemoryINDEXED
Semantic MemoryINDEXED
Project MemoryINDEXED
Agent MemoryINDEXED
Workflow MemoryINDEXED
Relationship MemoryINDEXED
Preference MemoryINDEXED
Long-Term MemoryINDEXED
4D MEMORY INTELLIGENCE CORE
ACTIVE MEMORY
VECTOR MEMORYSemantic recall + similarity retrieval
STRUCTURED DATABASEUsers, projects, state + facts
KNOWLEDGE GRAPHEntities, relations + connected context
PROJECT MEMORYGoals, files, agents + checkpoints
ARTIFACT REGISTRYCode, documents + generated outputs
RETRIEVAL RANKINGRight memory → right decision
REMEMBERRETRIEVERANKCOMPRESSUSEUPDATEFORGET
INTERCONNECTED MEMORY: AION does not read every memory at once. It identifies the current intent, retrieves candidate memories from vector + structured + project stores, ranks relevance, compresses the selected context, uses it for the decision, then updates the durable project state.
Decision Intelligence
Observe. Reason. Decide. Execute. Learn.
AION can evaluate alternatives instead of blindly triggering the first available action.
OBSERVE
UNDERSTAND
RECALL
GENERATE OPTIONS
PREDICT
RISK ANALYSIS
COST ANALYSIS
DECIDE
EXECUTE
LEARN
Multi-Agent Orchestration
Multiple agents. Multiple paths. One controlled outcome.
Workflows can combine specialists in parallel, sequence, loops, conditions, debates and hierarchical teams. When no suitable specialist exists, the system can create a task-scoped agent dynamically.
SequentialAgent A → Agent B → Agent C, with structured handoffs.
ParallelIndependent specialist agents work simultaneously and merge results.
ConditionalBranch execution based on confidence, state, policy or output.
LoopCreate → Test → Critique → Improve, bounded by time, cost and retry limits.
Dynamic Agent Foundry
Create the specialist only when the work demands it.
The platform is not limited to a fixed catalog of agents.
Capability Gap
→
Define Role
→
Choose Model
→
Assign Tools
→
Apply Permissions
→
Load Knowledge
→
Test Agent
→
Execute
→
Verify
→
Archive / Promote
AION UNIVERSAL AI WORKSPACE
Many AI companies. One AION intelligence layer.
AION routes each task to suitable intelligence by capability, context, tool/file needs, latency and cost — while AION keeps the project memory, files, permissions and verification workflow continuous.
LIVE ORCHESTRATION MODEL
AI PROVIDERSExternal intelligence engines
OpenAI
Reasoning • coding • multimodal

Anthropic
Long context • coding • review

Gemini
Research • multimodal • context

DeepSeek
Fast/value coding • reasoning

Meta Llama
Open-model ecosystem

Mistral
Efficient open-weight intelligence

xAI
General reasoning • tools

OpenRouter
Multi-provider model gateway
L
Local / Offline AI
Private enterprise intelligence
EBOLA AION
AION PROVIDER BUS
Understanding goal + project context
OpenAI
→ AION →
Coding Agent
SHARED AION MEMORYProject • files • decisions • outcomes
AION SPECIALIST AGENTSReceive routed work with context
Coding AgentCODIAX • build • debug • refactor
Research AgentEvidence • sources • synthesis
Commerce AgentRetail • operations • workflows
Media AgentImage • video • voice • design
Memory AgentRecall • resume • project state
Judge AgentCompare • verify • evidence
Automation AgentTools • APIs • scheduled execution
Best intelligence per taskCapability-aware routing instead of locking every job to one model.
One project memoryContext remains in AION even when the underlying model changes.
Files + version continuityProvider output becomes a canonical AION project asset.
Fallback + consensusEscalate, retry or compare multiple intelligence engines when required.
Judge before deliveryVerification, evidence and project-state update before final output.
AION architecture ruleExternal AI models are intelligence engines. AION remains the operating system that owns project continuity, memory, files, permissions, routing and verification.
CONNECTIVITY · NLP · MCP · A2A · EVENT INTELLIGENCE
The robotic nervous system for autonomous work.
AION first understands the human request with NLP, then routes context through MCP, agent-to-agent communication, APIs, business data and an event bus. The result is one interconnected technical nervous system — not isolated AI boxes.
NEURAL ROUTER ACTIVE
AION 4D CONNECTIVITY MAP · LIVE PACKET ROUTING
NLPHuman language → intent, entities, context and task structure.
MCPStandardized agent access to tools, data and knowledge services.
A2AAgent ↔ agent delegation, context transfer, evidence and results.
API / WEBHOOKConnect websites, CRM, apps, services and external business systems.
EVENT BUSAsynchronous triggers that wake the right workflow at the right time.
DATA + MEMORYProject state, database facts and retrieval context feed decisions.
NLP · Understand
INPUT LAYER
NLP converts a natural-language request into intent, entities, constraints, language, context and a machine-routable task.
MESSAGEINTENTCONTEXTROUTE
MCP · Connect Tools
TOOL LAYER
MCP gives an AI agent a controlled way to discover and call approved tools, files, databases and knowledge capabilities.
AGENTMCPTOOLRESULT
A2A · Agent Network
TEAM LAYER
A2A lets specialist agents delegate work, pass context and evidence, and return structured results to the orchestrator.
MASTERAGENT AAGENT BVERIFY
API + Webhooks
SYSTEM LAYER
APIs request data/actions. Webhooks push real-time events back into AION when something changes in another system.
AIONAPISERVICEEVENT
Event Bus · Trigger
AUTONOMY LAYER
The event bus decouples workflows: a file, schedule, customer event, database change or completed task can trigger the next agent automatically.
EVENTQUEUEROUTERAGENT
Event-Driven Agent Network
Watch how different events can enter the same nervous system and activate the correct specialist workflow.
User Message
Time / Schedule
New File
Email Event
Webhook
Database Change
Customer Event
Agent Event
Task Completed
System Alert
LIVE LOGIC: Event → NLP / Context → Policy & Memory → MCP / API / A2A Route → Specialist Agent → Tool Execution → Verification → Result → Memory Update.
Agent Identity & Zero Trust
Every agent has identity, authority and limits.
Autonomy is powerful only when every action is attributable, permissioned and auditable.
01
Agent Identity
Unique identity, owner, role, parent agent and execution session.
02
Least Privilege
Only the tools, data and actions needed for the assigned task.
03
Human Approval
Consequential actions can pause until explicit human authorization.
04
Credential Vault
Secrets remain isolated from normal agent context and output.
05
Sandbox Execution
Code and risky operations can run in controlled environments.
06
Audit & Trace
Every plan, agent, tool call, approval and result can be traced.
72 / 72 Master Capability Matrix
Agentic AI plus the new Autonomous Intelligence layers.
Intelligence, memory, orchestration, execution, trust, persistence, cognitive prompting, multi-AI routing and cross-provider continuity in one architecture.
01Auto Intent Intelligence
02Persistent Memory
03Decision Engine
04Multi-Agent Orchestration
05Dynamic Agent Creation
06Agent-to-Agent Communication
07MCP Tool Connectivity
08API / Webhook Connectivity
09Event-Driven Automation
10Execution & Recovery
11Zero-Trust Agent Security
12Cost Intelligence
13Language & NLP
14Context Understanding
15Complexity Detection
16Auto Mode Selection
17Model Router
18Tool Router
19Agent Router
20Dynamic Planning
21Sequential Workflow
22Parallel Workflow
23Conditional Workflow
24Hierarchical Agents
25Debate Pattern
26Voting / Judge Pattern
27Controlled Agent Loops
28Critic Agent
29Verifier Agent
30Retry Engine
31Re-plan Engine
32Checkpoint Engine
33Resume Engine
34Background Runs
35Long-Running Jobs
36Scheduling
37Event Triggers
38Workflow Composer
39Agent Builder
40Agent Teams
41Agent Marketplace
42Knowledge / RAG
43Knowledge Graph
44Vector Memory
45Project Memory
46Agent Memory
47Workflow Memory
48Long-Term Memory
49Memory Retrieval / Ranking
50Memory Forget / Update
51Human Approval Engine
52Permission Engine
53Credential Vault
54Sandbox
55Policy Engine
56Audit Trail
57Observability / Tracing
58Evaluation Engine
59Artifact Registry
60Persistent Projects
61Cognitive Prompt Compiler
62Semantic Intent Router
63Language Noise Normalizer
64Temporal Truth Resolver
65Hybrid Memory Retrieval
66Cross-Agent Memory Broker
67Failure & Lesson Memory
68Evidence Confidence Judge
69Universal AI Provider Bus
70Multi-Model Consensus
71Universal File Workspace
72Cross-Provider Continuity
AION DEPARTMENT · CODIAX
CODIAX is AION’s autonomous software engineering workforce.
CODIAX remains the specialist engineering environment for repository understanding, multi-file builds, debugging, tests, security, Git, deployment, visual development and application creation. The new AION layers add cross-session memory, universal files, provider routing and cognitive task compilation around that engineering power.
AION MASTER BRAINGoal · Memory · Provider · Agents↓
CODIAXArchitecture · Frontend · Backend · DB · Security · Testing · Deployment
↓
VERIFIED SOFTWARE ASSETSFiles · Versions · Tests · Evidence · Checkpoints
ONE PERSON • COMPLETE AI WORKFORCE
Build a One‑Person AI Company.
One human stays the owner and decision authority. AION understands the goal, recalls the project, compiles the work, chooses intelligence and coordinates specialist AI departments for strategy, research, sales, marketing, support, finance, operations, media, CODIAX engineering and delivery — inside one continuous operating system.
60 AI AgentsMulti‑Agent TeamsHuman ApprovalVerified Outputs24×7 Automations
YOUOWNER + DECISION AUTHORITY
STRATEGY AIPlanning • Research
SALES AILeads • CRM • Follow-up
MARKETING AIContent • Campaigns
CODIAX AIApps • APIs • Code
OPERATIONS AITasks • Automation
FINANCE AIAnalysis • Records
01HUMAN GOAL
02MASTER BRAIN
03AI PLAN
04AGENT TEAMS
05VERIFY + APPROVE
06BUSINESS OUTPUT
WHO YOU ARE?
Choose your role. AION changes the workspace around you.
Seven segments. One AI operating system. Click your segment to see the matching AI role, workspace and certificate pathway.
YOU ARE: FAMILY
AI Family
Turn daily family learning into a structured AI workspace with safe profiles, projects and evidence-backed progress.
Family AI Workspace
Learning & project history
Member work passports
Document / research support
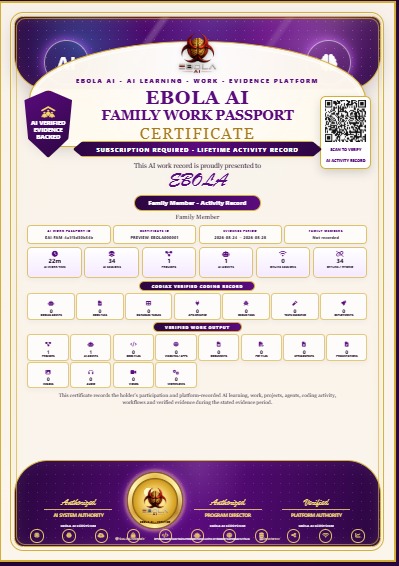 AI Family Certificate Pathway
Certificate requires applicable verified activity / completion evidence.
AI Family Certificate Pathway
Certificate requires applicable verified activity / completion evidence.
YOU ARE: STUDENT
AI Student
Build practical AI capability through research, assignments, coding, projects and verified learning evidence.
Student project workspace
Research & study agents
Coding / document tools
Verified skill passport
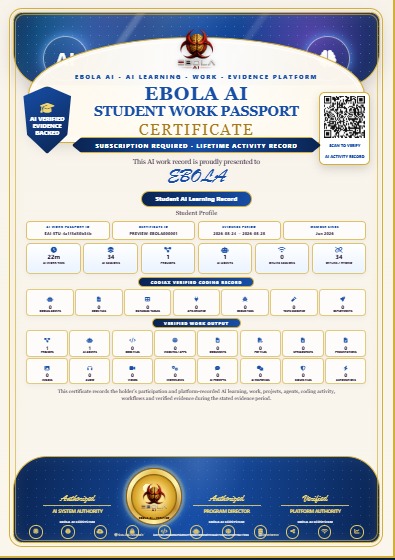 AI Student Certificate Pathway
Certificate requires applicable verified activity / completion evidence.
AI Student Certificate Pathway
Certificate requires applicable verified activity / completion evidence.
YOU ARE: SCHOOL / INSTITUTE
AI Institution
Operate a branded institution AI workspace, manage learners and track verified AI activity.
Institution dashboard
Student enrolment
Work Passport tracking
Certificate administration
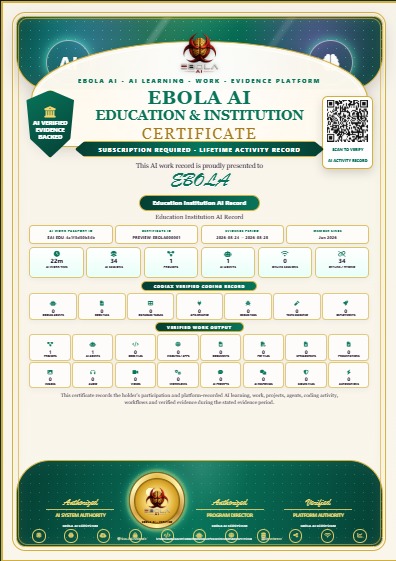 AI Institution Certificate Pathway
Certificate requires applicable verified activity / completion evidence.
AI Institution Certificate Pathway
Certificate requires applicable verified activity / completion evidence.
YOU ARE: SHOP / RETAIL
AI Retail
Use agents for products, inventory, customer support, marketing, CRM and everyday business operations.
Inventory & product agents
Customer support
Sales / marketing workflows
Business automation
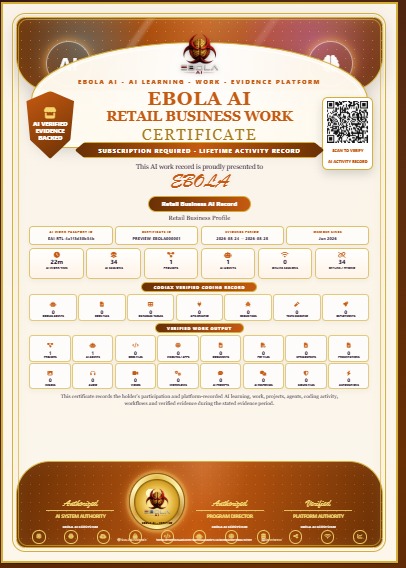 AI Retail Certificate Pathway
Certificate requires applicable verified activity / completion evidence.
AI Retail Certificate Pathway
Certificate requires applicable verified activity / completion evidence.
YOU ARE: EMPLOYEE / COMPANY
AI Workplace
Create a professional AI work layer for tasks, documents, analysis, workflows and departmental productivity.
Department AI assistants
Task & document workflows
Verified work artifacts
Privacy controls
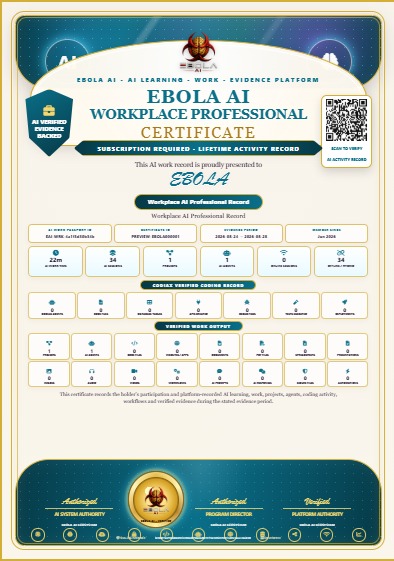 AI Workplace Certificate Pathway
Certificate requires applicable verified activity / completion evidence.
AI Workplace Certificate Pathway
Certificate requires applicable verified activity / completion evidence.
YOU ARE: CREATOR / DEVELOPER
Agentic AI Creator
Build agents, apps, APIs, automations, websites and digital media using an integrated creator workspace.
CODIAX engineering
Agent builder
API / workflow creation
Testing & deployment
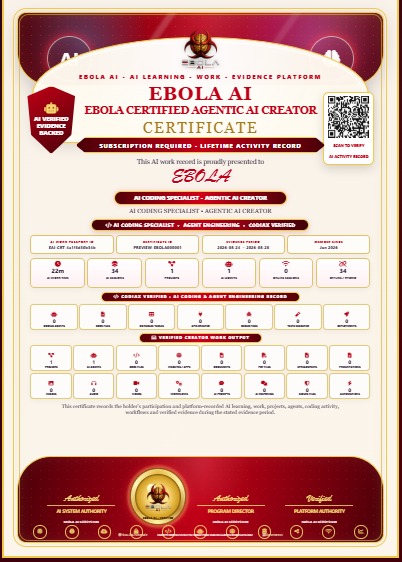 Agentic AI Creator Certificate Pathway
Certificate requires applicable verified activity / completion evidence.
Agentic AI Creator Certificate Pathway
Certificate requires applicable verified activity / completion evidence.
YOU ARE: ONE-PERSON COMPANY
AI Agency / Company
Coordinate an AI workforce across strategy, sales, operations, finance, technology and creative delivery.
AI departments
Multi-agent teams
Client delivery workflows
Approval & audit controls
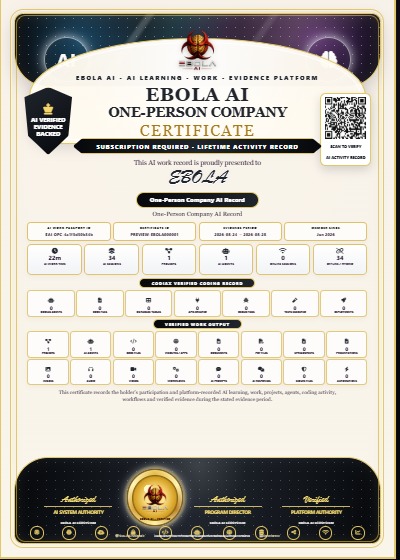 AI Agency / Company Certificate Pathway
Certificate requires applicable verified activity / completion evidence.
AI Agency / Company Certificate Pathway
Certificate requires applicable verified activity / completion evidence.
7 CERTIFICATES · ONE AI WORK PASSPORT
Your role becomes verified AI work evidence.
These seven certificate pathways belong directly to “Who You Are”. Click any certificate to preview it. Issuance remains based on applicable learning, projects, AI work hours and verified evidence.
01 · AI Family Learning CertificateFamily learning, projects and AI-work evidence.
02 · AI Student Skill CertificateStudent research, projects, skills and work evidence.
03 · AI Coaching / Training CertificateInstitution, coaching and training activity evidence.
04 · AI Retail Business CertificateRetail, shop, CRM, inventory and automation evidence.
05 · AI Workplace Skill CertificateProfessional AI productivity and workflow evidence.
06 · Agentic AI Creator CertificateCODIAX, agents, APIs, testing and deployment evidence.
07 · One-Person Company / AI AgencyMulti-agent business delivery and project evidence.
AGENTIC AI GIGS COMMUNITY
Turn verified AI skills into real service work.
Explore AI research, content, automation, development, retail, training and business-operation gig pathways. Work → evidence → Work Passport.
AGENTIC AI FUNDING
Build a project. Match India + global AI funding.
Use the AI Work Passport, project evidence and specialist funding workflow to discover suitable official opportunities, prepare DPRs and support authorized applications.
WHAT AGENTIC AI DOES · 8 STAGES · SAME AION AGENT
From “answer me” to “complete the goal.”
The same AION agent changes responsibility, expression and visible activity at every stage — understand, remember, decide, plan, coordinate, execute, verify and deliver.
01
LISTENING / PARSING
Understand
Interprets the user’s intent, language, context, constraints and expected outcome before any action begins.
SAME AION AGENT · INPUT MODE
02
PROJECTCHATMEMORY
RECALLING MEMORY
Remember
Recalls the most relevant project history, conversation context, semantic knowledge and prior workflow state.
SAME AION AGENT · RETRIEVAL MODE
03
AB
COMPARING OPTIONS
Decide
Evaluates options against evidence, confidence, risk, cost and expected impact to select the strongest route.
SAME AION AGENT · DECISION MODE
04
BUILDING TASK MAP
Plan
Transforms the goal into an executable plan with tasks, dependencies, branches, approval gates, timing and budgets.
SAME AION AGENT · PLANNING MODE
05
A1A2A3
COORDINATING TEAM
Build Workforce
Builds the right specialist team, assigns roles and permissions, and coordinates agents around one shared objective.
SAME AION AGENT · ORCHESTRATION MODE
06
TOOLS / API ACTION
Execute
Executes approved actions through models, tools, APIs, MCP connections, databases and event-driven workflows.
SAME AION AGENT · EXECUTION MODE
07
SCANNING / RECOVER
Verify & Recover
Validates results, detects failures, retries safely, re-plans when needed and resumes from trusted checkpoints.
SAME AION AGENT · VERIFICATION MODE
08
✓OUTPUT
DELIVER / LEARN
Deliver & Learn
Delivers verified outputs, records evidence, updates approved memory and improves future execution from completed work.
SAME AION AGENT · DELIVERY MODE
01 UNDERSTAND → 02 REMEMBER → 03 DECIDE → 04 PLAN → 05 WORKFORCE → 06 EXECUTE → 07 VERIFY → 08 DELIVER
5 AGENTIC AI SUBSCRIPTION OPTIONS
One subscription ecosystem. Choose how you want to use EBOLA AI.
Every active subscriber gets Agent AI Login and access to the Retail AI ecosystem. GST 18% is shown separately at billing.
AION Essential
Personal Agentic AI tools and workspace.
₹500 / month + GST≈ $— • Local —
Agent AI Login + EBOLA AI workspace
AI tools, files, research and supported utilities
Retail AI access included
POPULAR
ADVANCED AI
AION Pro
Advanced Agentic AI + automation.
₹1,000 / month + GST≈ $— • Local —
Everything in Essential
Advanced AI workflows + automation
Agent AI Login + Retail AI access
5GWi-Fi Connection
Family Pack
Main subscriber + up to 3 family IDs.
₹5,000 / month + GST≈ $— • Local —
5G Wi-Fi Connection BenefitInstall an eligible real 5G connection, submit the verified bill and claim reimbursement. Keep the ₹5,000 package active monthly for continued eligible monthly bill support.
Up to 3 family IDs + main account
Agent AI + Retail AI ecosystem
5GRetail Wi-Fi
Retail AI
Agentic AI + Travel + Utility + B2B retailer services.
₹5,000 / month + GST≈ $— • Local —
Retailer 5G Wi-Fi Bill SupportInstall an eligible real 5G connection and submit the verified bill for reimbursement. Continued monthly bill payment/support requires the ₹5,000 package to remain active and is subject to programme verification/terms.
Retail AI Agent Login + B2B utility access
Travel, recharge, bill pay, money transfer and Mini ATM ecosystem
Set commission / earn features where provider rules permit
One Person Company
Build an AI workforce around one human operator.
₹5,000 / month + GST≈ $— • Local —
AI workforce + business automation workspace
Multi-agent operations for business departments
Agent AI Login + Retail AI access included
5G reimbursement: available only for eligible connections, verified bills and qualifying active packages under EBOLA AI programme terms. Provider availability and service eligibility may vary.
GLOBAL SUBSCRIPTION ALLOCATION SIMULATOR
Agentic AI Gigs subscriptions — monthly allocation model.
Select a country, package, customer volume and number of qualifying AI Achievers. The model shows subscription collection, a proposed 30% AI Achievers Club pool, a proposed 10% direct-referral amount on personally referred subscriptions, and the resulting local-currency values using the existing live FX endpoint.
LIVE FX + 4D DISTRIBUTION VIEW

Auto DetectUSD • Live rate
Loading…Using /relay/live_usd_rate.php
Build the monthly subscription scenario
Package price remains the programme price in INR; USD and selected local currency are converted from your live FX source.
MONTHLY SUBSCRIPTION COLLECTION
₹49,900
≈ USD / local currency loading…
4D monthly allocation map
The centre is subscription collection. The animated routes show how the proposed programme buckets are calculated.
₹49.9KMONTHLY COLLECTION
AI ACHIEVERS CLUBProposed 30% monthly pool₹14,970
DIRECT REFERRALProposed 10% of personally referred active subscriptions₹49.90
PER ACHIEVER SHARE30% pool ÷ qualifying achievers₹149.70
REMAINDERCollection remaining after displayed proposed buckets₹34,880
30% AI ACHIEVERS CLUB POOL₹14,970
PER QUALIFYING ACHIEVER₹149.70
YOUR 10% DIRECT REFERRAL₹49.90
ANNUAL SUBSCRIPTION COLLECTION₹5,98,800
AI Achievers Club
If programme rules designate 30% of eligible subscription collection to the Achievers Club, this calculator divides that pool equally across the number of qualifying achievers entered above.
Per Achiever = Eligible Collection × 30% ÷ Qualifying Achievers
Personally referred active subscriptions
The displayed 10% amount is calculated only on the package value of the active subscriptions attributed to the selected sponsor/referrer in this scenario.
Direct Referral = Package Price × Personal Active Directs × 10%
Important programme/compliance note: this page is an illustrative allocation simulator, not a promise of income, return or entitlement.
A subscription should purchase genuine AI software/services. Any commission or club allocation should apply only under published programme terms,
verified qualifying sales/service activity, refund/reversal rules, tax requirements and applicable direct-selling/consumer law.
Merely joining, recruiting a person or buying a membership should not by itself create compensation. Live currency values depend on your
/relay/live_usd_rate.php response and may differ from card/bank settlement rates.
LIVE MONTHLY REVENUE SHARING • 13 CLUBS
See exactly how the 30% monthly pool is calculated.
The current-month subscription activation value is treated as 100%. Only 30% becomes the distributable monthly club pool. The 12 published club weights divide that 30% pool — not the gross collection.
LIVE DATABASE CALCULATION
100% CURRENT-MONTH SUBSCRIPTION VALUE
₹16,000.00
→
30% DISTRIBUTABLE MONTHLY POOL
₹4,800.00
→
12 CLUB WEIGHTS
100% OF THE 30% POOL
SUBSCRIPTION ACTIVATIONS THIS MONTH
13
UNIQUE SUBSCRIPTION USERS
12
CLUB WEIGHT TOTAL
100%
LIVE SOURCE
ai_subscriptions × ai_subscription_plans.price_inr
🇮🇳 INDIA BILLING • 18% GST EXTRA AT PAYMENT
₹499 + ₹89.82 GST = ₹588.82
₹999 + ₹179.82 GST = ₹1,178.82
₹4,999 + ₹899.82 GST = ₹5,898.82
30% CLUB POOL USES BASE PRICE • GST EXCLUDED
20%
AI-V1 Agentic AI Gigs Club
AI-V1 or above: Team $2,000/$2,000 OR Self $5,000 AUTO
CLUB POOL
₹960.00
QUALIFIED IDs
7
PER MEMBER*
₹137.14
15%
AI-V2 Agentic AI Gigs Club
AI-V2 or above: Team $7,000/$7,000 OR Self $10,000 AUTO
CLUB POOL
₹720.00
QUALIFIED IDs
1
PER MEMBER*
₹720.00
10%
AI-V3 Agentic AI Gigs Club
AI-V3: Team $17,000 Left + $17,000 Right
CLUB POOL
₹480.00
QUALIFIED IDs
0
PER MEMBER*
₹0.00
5%
$250 Club
Self total_topup = exactly $250
CLUB POOL
₹240.00
QUALIFIED IDs
24
PER MEMBER*
₹10.00
5%
$500 Club
Self total_topup = exactly $500
CLUB POOL
₹240.00
QUALIFIED IDs
11
PER MEMBER*
₹21.82
5%
$1,000 Club
Self total_topup = exactly $1,000
CLUB POOL
₹240.00
QUALIFIED IDs
21
PER MEMBER*
₹11.43
5%
$5,000 Club
Self total_topup = exactly $5,000
CLUB POOL
₹240.00
QUALIFIED IDs
0
PER MEMBER*
₹0.00
5%
$10,000 Club
Self total_topup = exactly $10,000
CLUB POOL
₹240.00
QUALIFIED IDs
0
PER MEMBER*
₹0.00
2%
₹499/₹500 Monthly Subscription Club
2 fresh direct qualifying subscriptions this month
CLUB POOL
₹96.00
QUALIFIED IDs
0
PER MEMBER*
₹0.00
3%
₹999 Monthly Subscription Club
3 fresh direct ₹999 subscriptions this month
CLUB POOL
₹144.00
QUALIFIED IDs
0
PER MEMBER*
₹0.00
5%
₹4,999 Family / Workspace Monthly Club
5 fresh direct ₹4,999 Family/Workspace subscriptions this month
CLUB POOL
₹240.00
QUALIFIED IDs
0
PER MEMBER*
₹0.00
10%
72-Hour Agentic AI Gigs Club
HOT: within 72 hours after your ID top-up, refer 2 × ₹4,999 Family Packs — 1 direct Left + 1 direct Right
CLUB POOL
₹480.00
QUALIFIED IDs
0
PER MEMBER*
₹0.00
QUALIFICATION WINDOW
72:00:00
1 DIRECT LEFT
1 DIRECT RIGHT
2 × ₹4,999 FAMILY PACKS
Timer starts when your ID qualifying top-up is recorded. Complete both direct Family Pack subscriptions before 72 hours ends to enter the 10% club.
Timer starts when your ID qualifying top-up is recorded. Complete both direct Family Pack subscriptions before 72 hours ends to enter the 10% club.
★★★★★★★★★★★
11 PLAYERS CLUB
11 Golden Achievers • Admin Selected Leadership Circle • 10% Club Pool
PLAYER 1
•••
PLAYER 2
•••
PLAYER 3
•••
PLAYER 4
•••
PLAYER 5
•••
PLAYER 6
•••
PLAYER 7
•••
PLAYER 8
•••
PLAYER 9
•••
PLAYER 10
•••
PLAYER 11
•••
★ ACHIEVERS 0 / 11
WHO WILL BE THE 11 PLAYERS?
• • • • • • • • • • •
11 PLAYERS CLUB POOL
₹480.00
ACTIVE ACHIEVERS
0 / 11
PER PLAYER*
₹0.00
Current-month subscription rows are joined to the subscription plan master to obtain the INR plan value.
Monthly Value = Σ ai_subscription_plans.price_inr
Only thirty percent of that monthly subscription activation value enters the 13-club distribution model.
Distribution Pool = Monthly Value × 30%
Each club gets its published percentage of the 30% pool. That club amount is divided by the currently qualified IDs.
Per Member = 30% Pool × Club Weight ÷ Qualified IDs
Important: AI-V qualification uses full LEFT/RIGHT placement genealogy to extreme depth.
AI-V1 can also qualify automatically from Self total_topup ≥ $5,000; AI-V2 can also qualify automatically from Self total_topup ≥ $10,000.
AI-V3 requires $17,000 Left + $17,000 Right.
AI rank pools are cumulative: AI-V2 participates in V1 + V2, and AI-V3 participates in V1 + V2 + V3.
Dollar clubs are exact self-total_topup clubs.
India billing rule: Base subscription prices are ₹499, ₹999 and ₹4,999. Add 18% GST at checkout. Card/debit-card/USDT payment converts the GST-inclusive invoice total at the live checkout FX rate. Revenue sharing uses the base subscription amount before GST; GST is excluded from club distribution. Store base_inr, gst_rate, gst_amount, invoice_total_inr, charged_currency, charged_amount, fx_rate and provider transaction ID.
Accounting note:
Accounting note:
ai_subscriptions does not store an actual payment amount.
This public live display therefore shows subscription activation value using
ai_subscription_plans.price_inr. Final payout accounting should use the verified checkout/payment ledger and a locked month-end snapshot.
100% AI USAGE REVENUE MAP
See every ₹100 distributed visually.
Use the calculator to model qualifying AI-service usage. Subscription is shown separately because subscription access and eligible AI usage are different ledgers.
100%QUALIFYING AI USAGE
Community / Club Pool30%
Eligible Service Referrer10%
Eligible Member Pool50%
Platform Operations10%
DYNAMIC DISTRIBUTION CALCULATOR
AI Revenue Simulator
Enter an amount and choose what it represents.
AMOUNT (₹)
CALCULATE AS
30% COMMUNITY / CLUB₹3,000$—
10% SERVICE REFERRER₹1,000$—
50% MEMBER POOL₹5,000$—
10% PLATFORM OPERATIONS₹1,000$—
Usage mode: illustrative allocation of qualifying completed AI-service usage under published programme rules.
AI SERVICE REVENUE MODEL
30% community allocation from eligible AI usage revenue.
Subscription and AI usage are kept separate. Subscription activates software/workforce access; eligible completed AI-service usage is recorded in the AI Wallet ledger and can follow published service-revenue allocation rules.
SUBSCRIPTION LEDGER
Workspace / Agent Activation
- ₹499 → any 1 Agent
- ₹999 → any 3 Agents
- ₹4,999 → all 60 Agents
- Plan validity, workspace and activation rights
Not automatically treated as AI-usage revenue sharing.
≠
AI USAGE LEDGER
Actual AI Service Consumption
- Model / token / API processing
- Image / video / voice generation
- Research / coding / tools
- Approved automation execution
Only qualifying completed service usage can enter the published allocation programme.
Community / Club Pool
Highlighted service-revenue allocation for eligible programme participants under published qualification rules.
Service Referrer
Eligible direct service referral allocation on qualifying AI-service usage, where programme rules permit.
Eligible Member Pool
Monthly service pool for qualifying role categories, based on verified service activity and programme rules.
Platform Operations
Infrastructure, providers, support, programme administration and operational reserve.
Important: This is presented as a service-revenue allocation model, not a fixed-return or investment product.
No compensation should arise merely from adding/recruiting a person. Eligibility should be tied to genuine paid services,
verified service activity and published programme terms; refunds, taxes, reversals and non-qualifying transactions may be excluded.
AGENTIC AI GIGS • WORK → EVIDENCE → SERVICE REVENUE
Build skills. Run AI services. Earn from real work.
AION Gigs turns AI capability into service roles. Responsibility, quality, client scope and verified delivery determine the commercial value — not merely joining the platform.
GIG 01
AI Research Operator
Research markets, competitors, products, sources and structured business intelligence.
Illustrative service opportunity₹500–₹5,000+ / project
GIG 02
AI Content & Media Creator
Create campaign concepts, posts, posters, images, video briefs, scripts and media packages.
Illustrative service opportunity₹1,000–₹15,000+ / project
GIG 03
AI Automation Builder
Design workflows for leads, CRM, support, documents, operations and repetitive business tasks.
Illustrative service opportunity₹3,000–₹50,000+ / project
GIG 04
Agentic AI Developer
Build agents, websites, dashboards, APIs, database integrations and tested software workflows.
Illustrative service opportunity₹5,000–₹1,00,000+ / project
GIG 05
Retail AI Operator
Help shops digitize products, customer support, campaigns, inventory and operational workflows.
Illustrative service opportunity₹2,000–₹25,000+ / client
GIG 06
AI Business Operator
Coordinate multi-agent delivery for a small company or client using specialized AI departments.
Illustrative service opportunityScope-based / recurring
GIG 07
AI Trainer / Institution Operator
Guide practical AI learning, projects, work-passport evidence and eligible institutional workflows.
Illustrative service opportunityProgramme / contract based
GIG 08
AI Agency Founder
Package research, marketing, automation, coding and support into a client-facing AI service business.
Commercial potentialDepends on clients & delivery
Earnings shown are illustrative service-pricing examples, not guaranteed income. Actual earnings depend on skill, client demand, scope, quality, geography, costs, taxes, platform/program rules and successful delivery. Revenue sharing should be tied to genuine qualifying AI-service activity rather than recruitment alone.
Simple Say. We Are Ebolians.
The user does not need to choose dozens of modes. AION understands the request, activates the required intelligence, coordinates execution and returns the result in one continuous workspace.
EBOLA AION • VIDEO AGENTIC AI
ONE VIDEO IDEA.
AN ENTIRE AI FILM CREW.
AION coordinates specialist video agents as one continuous production system — concept, script, storyboard, cinematic generation, live-motion scenes, avatar, voice, sound, editing, VFX, captions, localization and final delivery.
LIVE MOTION
4D CINEMATIC ENGINE
◆
16SPECIALIST VIDEO AGENTS
1AION ORCHESTRATOR
110+LANGUAGE / VOICE READY
4DLIVE MOTION WORKSPACE
Understands the brief, shot language, pacing and production goal.
Creates screenplay, scene dialogue, narration and shot-ready structure.
Turns the script into frames, camera directions and scene continuity.
Lens, angle, depth, camera motion, lighting and cinematic composition.
Creates text-to-video and image-to-video shots from production prompts.
Motion-picture sequences, tracking, movement continuity and dynamic scenes.
Digital presenters, characters, lip-sync and multilingual performance.
Voice-over, dialogue delivery, dubbing and language adaptation.
Background score, ambience, SFX, transitions and audio timing.
Auto cut, timeline assembly, rhythm, trimming and scene sequencing.
Titles, particles, compositing, graphics, backgrounds and visual effects.
Film look, exposure balance, tone matching and visual consistency.
Subtitles, captions, timing, accessibility and social-ready overlays.
Adapts voice, captions and delivery for global audiences.
Checks continuity, audio, framing, caption timing and export readiness.
Creates final formats for film, ads, Shorts, Reels, YouTube and campaigns.
AGENTIC VIDEO WORKFLOW
IDEA → CINEMA → DELIVERY
01Prompt / Brief
→
02Script
→
03Storyboard
→
04Generate Shots
→
05Live Motion
→
06Voice + Sound
→
07Edit + VFX
→
08Publish
VIDEO CREATION MODES
One workspace for every major video format.
🎬 Cinematic Film
🎞 Short Film
📺 Advertising
📱 Reels / Shorts
🎓 Education Video
🧑💼 Corporate Video
🛍 Product Video
🎵 Music Video
🧑🎤 Avatar Video
📰 News / Presenter
🎮 Game Cinematics
🧩 Motion Graphics
🎥 Documentary
🌐 Multilingual Dubbing
🖼 Image-to-Video
✍ Text-to-Video
ONE AION • COMPLETE VIDEO WORKFORCE
From a sentence to a finished motion picture.
ENTER VIDEO AGENTIC AI →